-

-

Project
Image Empire
-

Project
Data-centric AI
-

-

Project
Open Data Use Case Observatory
-

-

-
Project
Data Ethics Professionals
-

-
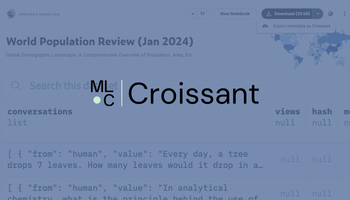
Project
Croissant
-

-

-

Project
The future of data and AI
-

Project
Microsoft
-

-
Project
Data-centric AI 2023-25
-

Project
Global data infrastructure
-

Project
Participatory data
-

-

-