
By Lawrence Kay
An agent based model (ABM) is useful in modelling consumer and company behaviour when levels of data-sharing – and other variables – change. Specifically, we wanted to look at how different levels of data sharing might affect a company’s ability to create and improve products.
The ODI team aren’t specialists in agent-based modelling, so we’re sharing some of what we learnt as we sought to bring the modelling technique into our consideration of the data economy. The insights below are written in a way that is more linear than the path taken by our work, but perhaps others could do more by working more sequentially. Our ABM – showing the impact of data sharing in the economy – was a mix of the ODI’s policy ideas and the data science expertise of our contractor Sandtable, who have also shared their experience of developing our model.
We spent a lot of time at the beginning of the modelling process trying to state how we thought firms behave when they are working with large amounts of data. This meant we wrote down lots of short statements like:
- ‘Industry data exploitation capacity is endogenous, and is determined by the capacity of firms and their access to human capital.’
- ‘Data is an input, with its value determined by how it is used.’
- ‘Firms are cautious about releasing data for fear that it boosts the innovation capacity of other firms.’
There was lots to debate about how and when these descriptions apply, but the process disciplined our thinking. It helped us to prioritise the conceptual features we wanted in the model and reduced some of the ambiguity in expressing our ideas to Sandtable. It also made it easier to generate hypotheses for what we expected to see in the model and meant we could track ideas as the model changed.
The Computational Modelling: Technological Futures report published by the Government Office for Science in 2018 helped us direct the development of the model. The first chapter described what the different approaches to computational modelling could offer us, what we might be able to do with the budget available, and how careful we needed to be with some of the risks of each.
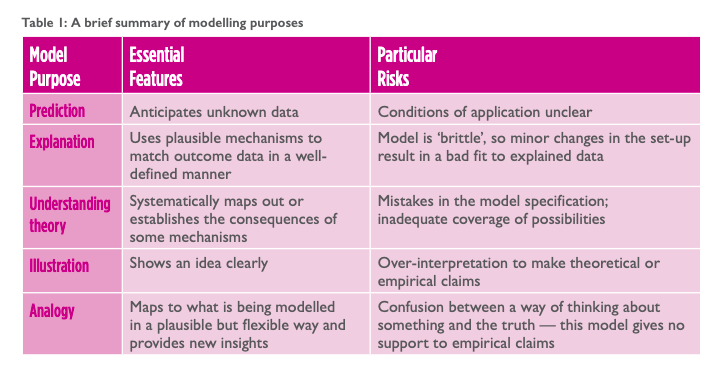
We chose to make an illustrative model because we had only a small budget available and just wanted to see how our ideas for data innovation might play out. The table below is from the report, and the column on the right helped us to understand what we wouldn’t be able to say with an illustrative model.
To get an idea of what an illustrative model might look like, we played with agent-based models that seemed to offer the simplicity, tractability, and interest that we were looking for in ours. Sandtable’s standing ovation model – an application of work by Scott E Page of the University of Michigan – clearly showed an idea, offered users interesting variables to play with and gave results that were easy to grasp. Lengnick's Baseline Economy helped us to see how one could do something similar, but with the aim of gaining insight into a simple economy.
After thinking about the ideas we were interested in and getting a feel for what might be possible, we eventually settled on a question that Sandtable could build the model around: what is the effect of openness on data sharing and innovation by companies? The economic statements and hypotheses we generated meant we could have explored a range of issues, like the effects of boosting data skills, what effects institutions like data trusts might have, or how better data ethics may affect the collection and use of data for innovation.
We might also have constrained the model to one industry, like we did with social networking during the first iteration of the model. Having one question has probably helped us to more quickly understand the model outputs, and seeing how the various economic ideas in the model might be working.
Once we had chosen a question and Sandtable started working on it, we were absorbed into the modelling process to a depth that perhaps we or they weren’t expecting. We knew that we wanted to learn through the process and were trying to test abstract ideas, but the decision to build an illustrative model in a frontier policy area – there is no extensive data sharing policy application anywhere in the world – meant that we spent a long time ‘mental modelling.’ And at the end of the process, this was probably the most valuable part of it: engaging colleagues around a shared concept of firm behaviour, consumer attitudes, and policy interventions in the economy improved our understanding and probably led to a better model than might otherwise have been the case.
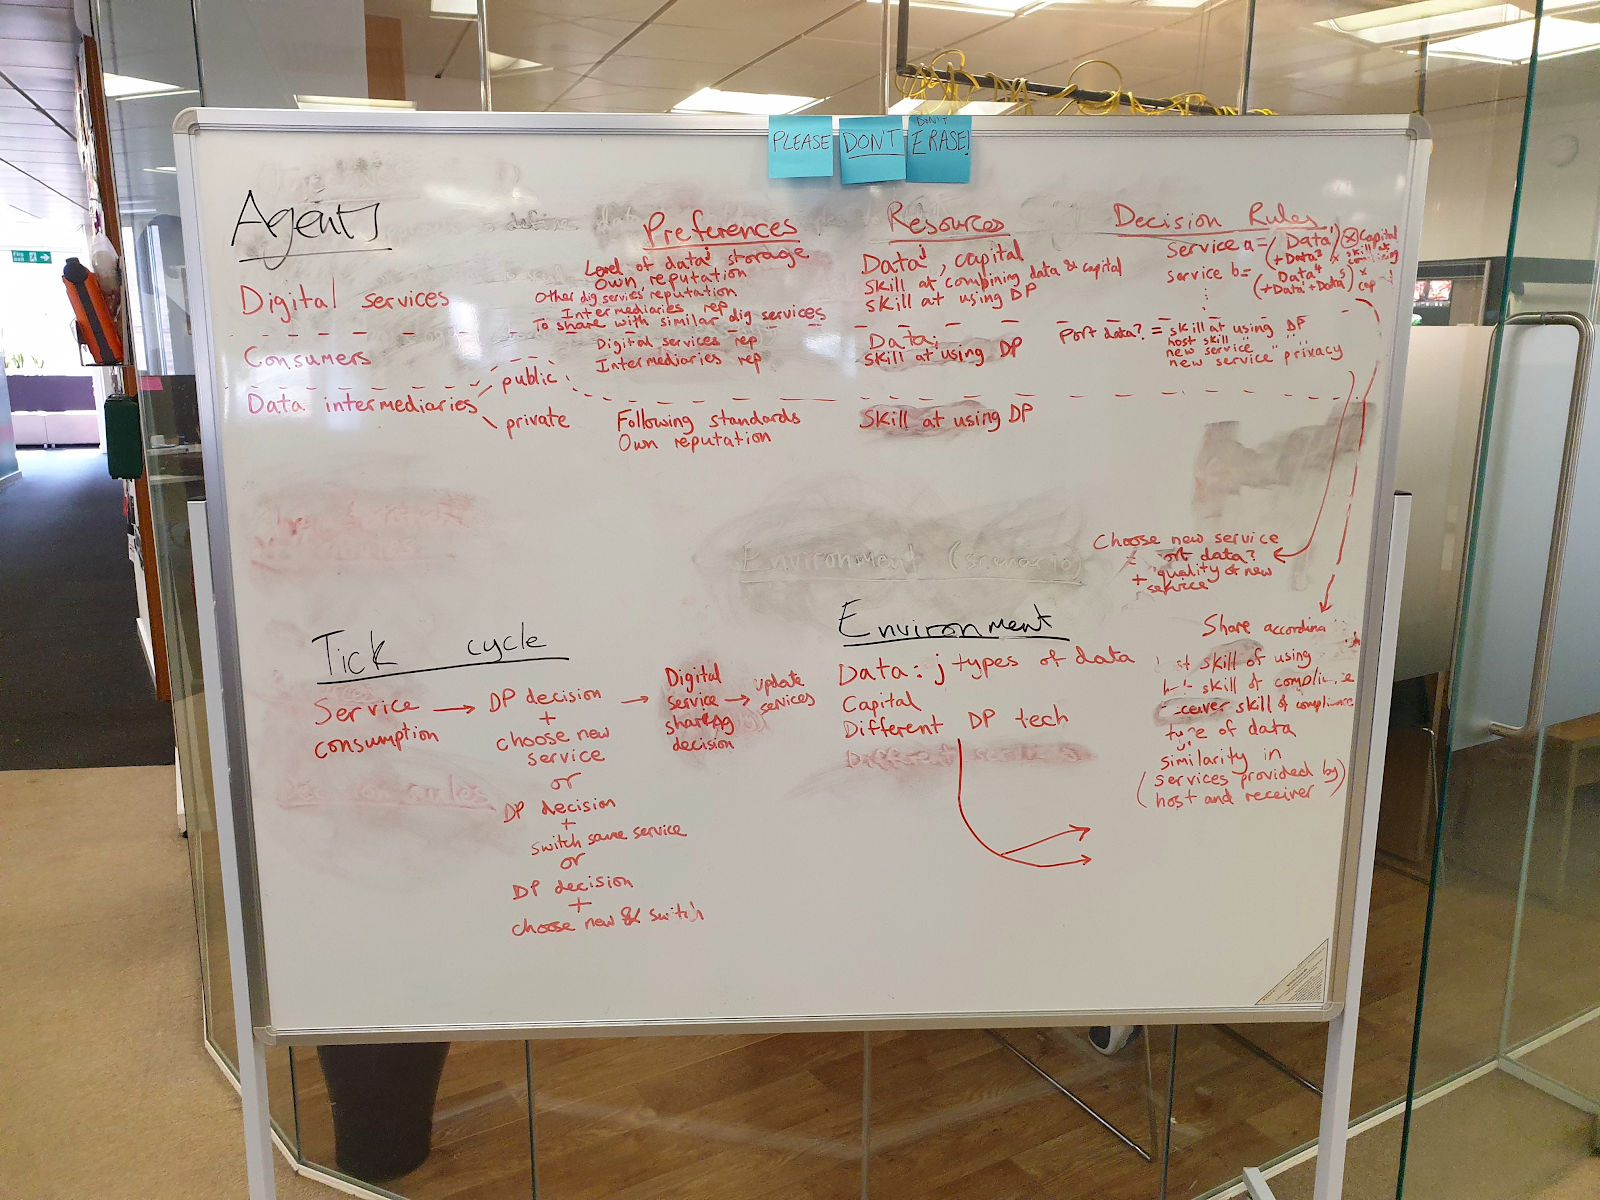
To help us with mental modelling, we made extensive use of Sandtable’s boxology tool. The tool really helped us to consider the characteristics we wanted to give to agents in the model, and to meticulously think through the steps in the tick cycle - demanding ourselves to be clear on what would happen first, then what would happen after that, and so on. The photo below shows how we worked on one of the boxologies.
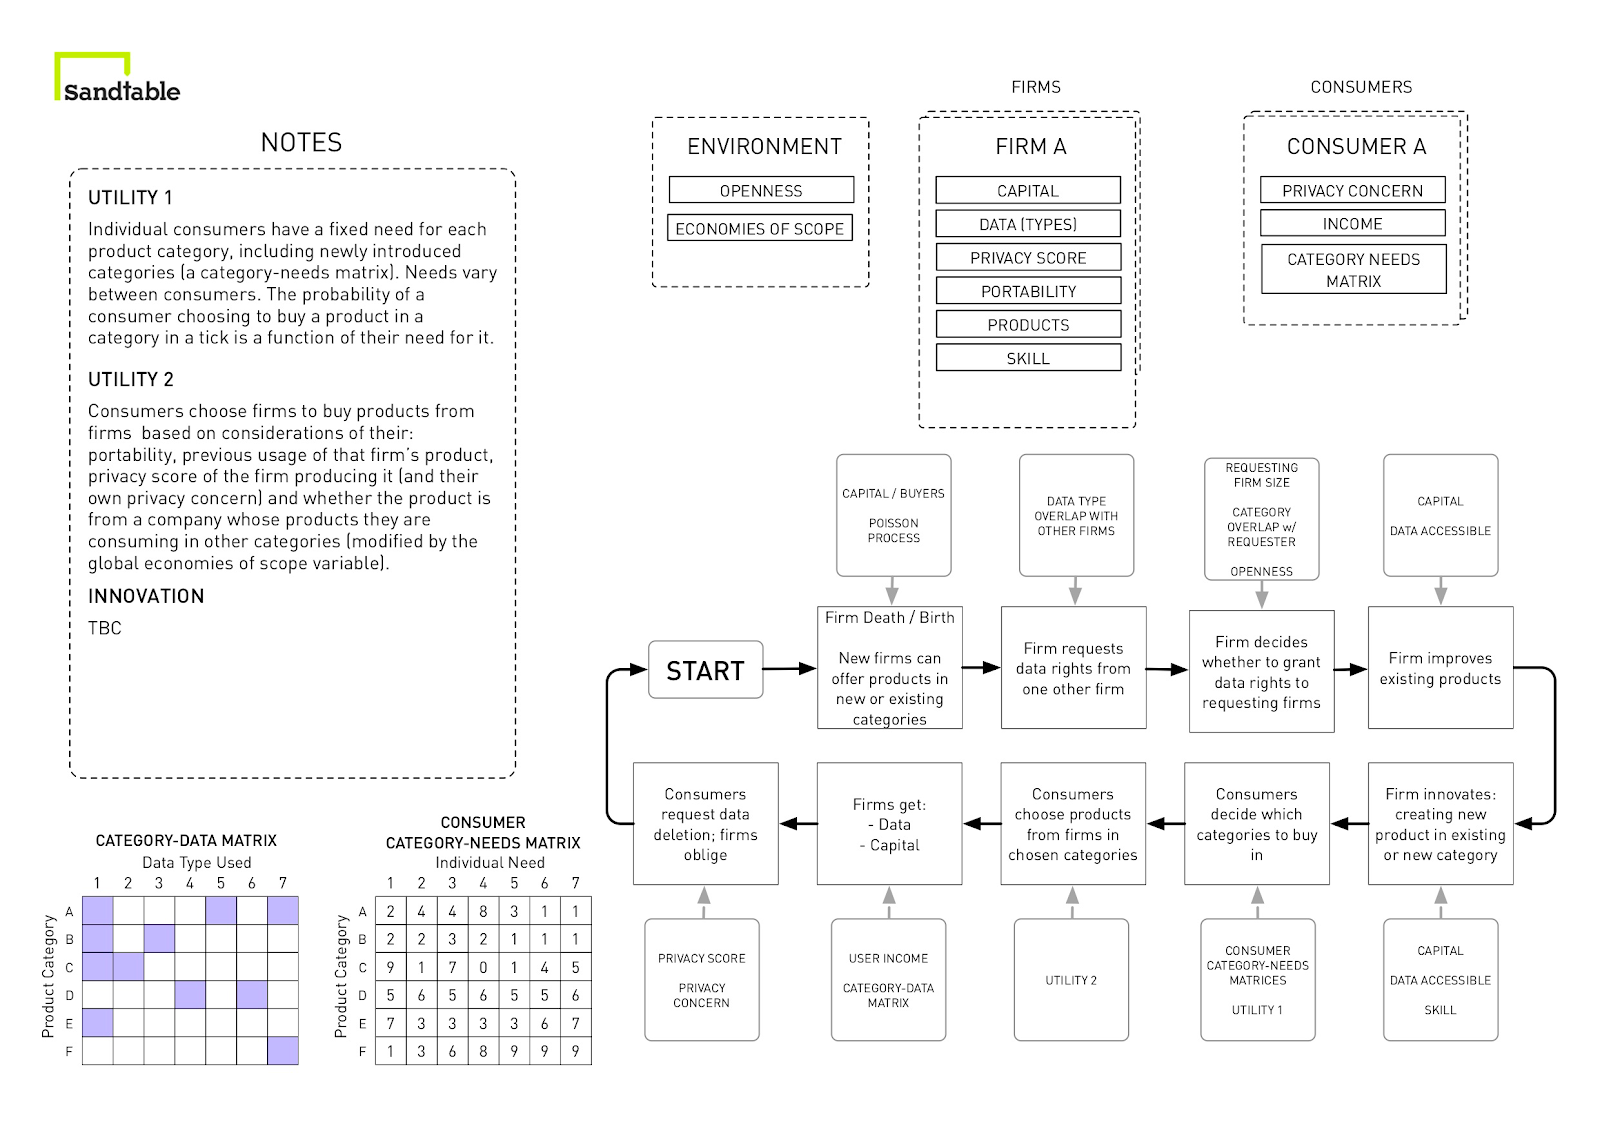
You can see the final boxology – the result of back-and-forth between us and Sandtable – below.
As the model developed we realised that it was becoming harder for us to explain it to people outside the project, and having an idea of users encouraged us to not add ever more complexity but instead think about how we might help others to engage with it.
This is why the options available to users within the app were restricted to a small handful, when we could have probably made nearly every aspect of it flexible to what users were interested in.
Now that the project is over and the model is done, we’re realising that we’re in for a long process of learning how to use it properly. The whole point of the model was to challenge us in how we think about data sharing for economic innovation, and showing the model to new users often provokes new questions that we hadn’t considered. This challenged us to better explain our understanding of how the model works.
Get in touch
It would be great if you could contribute your ideas on how to develop the model by using our feedback form.