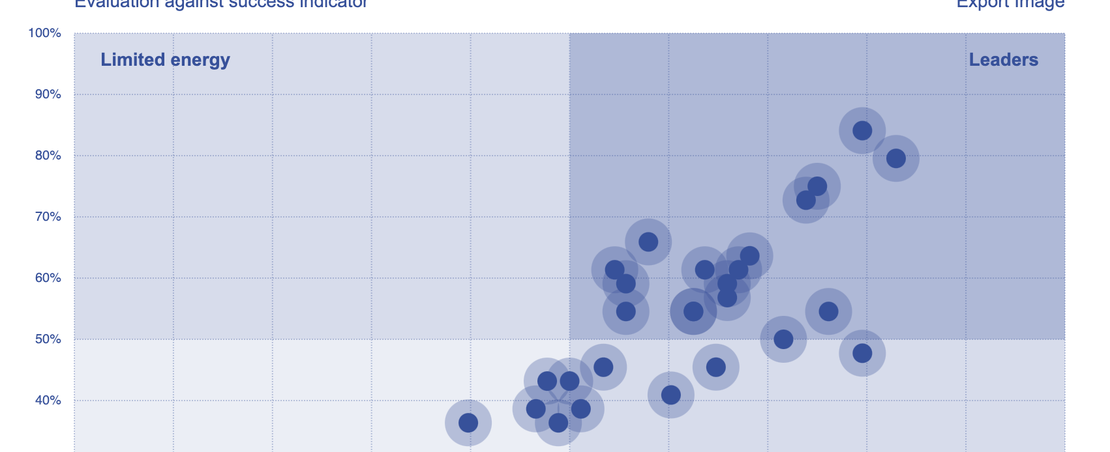
In September 2021 we launched a major new analysis, commissioned by Roche, of the policy landscape for secondary use of health data across Europe. This analysis was supported by a report and an award-winning interactive digital tool for exploring the findings.
We drew on our ODI Theory of Change and ODI manifesto to create a policy framework of the 22 policy components or success indicators for an open and trustworthy health data ecosystem for secondary use of health data. We then benchmarked the European Commission and 29 countries across the European region (25 EU member states and Israel, Norway, Switzerland and the United Kingdom), scoring each one against the quality of their policies, and the speed of their implementation. You can read more about our findings here, and how countries were clustered as Leaders, Limited Vision, Limited Energy, and Less Prepared.
In spring 2022, the European Commission (EC) announced the creation of the European Health Data Space (EHDS), a major new Europe-wide initiative for health data sharing and governance across Europe. So we’ve updated our digital interactive tool with new features to help strengthen wider engagement with the development of Europe’s health data policy.
'What does good look like?': benchmarking against the ODI manifesto
A summary of each country’s scores can help identify trends and opportunities across Europe. But it can also hide areas where each country may have further work to do.
Looking in more detail at where each country can improve the openness and trustworthiness of its individual ecosystem for secondary use of health data can allow more strategic action and help motivate countries to address gaps and obstacles.
We’ve added a new feature to the digital tool to explore country rankings by ODI manifesto areas: infrastructure, capability, innovation, equity, ethics and engagement. With this feature you can easily see which countries are leading in Europe in different areas, and where a country’s strengths or weaknesses in one area might be affecting its overall maturity score.
You can explore this feature on the digital tool here: our commentary is available in the report (Chapter 5).
‘What does good look like?’: introducing our library of good practice
Benchmarking is useful for planning and strategy, but policymakers also need practical examples of pilots, case studies and working models to better understand what their options are or to use as a basis for developing new approaches.
We’ve curated a selection of examples of good practice from across the European region, providing a range of case studies for each of our 22 policy indicators. This library of good practice also demonstrates that pockets of excellence can be found across Europe, and that each country has something useful to share and something to learn from others. As one senior representative from a health ministry put it to us: ‘Who is doing this well, and what can we steal with pride?’.
You can explore this feature on the digital tool here: our commentary is available with the report (suite of country profiles and scorecards).
Horizon scanning across the EC timeline
Over the next couple of years we expect health data policy activity in Europe to be particularly busy and high impact as the European Commission begins implementation of the European Health Data Space (EHDS). To support Europe’s health data ecosystem to develop in an open and trustworthy way, we believe it’s important that a wide range of stakeholders – including patient groups, researchers, startups, think tanks and journalists – are engaged and informed.
We’ve created an interactive timeline tool to track European Commission health data policy activity. Features for the new timeline tool include:
- Listings of key EC activities such as: launches, publications, consultations, calls for proposals, meetings, and conferences
- Ability to view and filter EC activities of interest by ODI manifesto area
- Ability to view and filter EC activities by their score for quality and/or for speed of implementation
- Features to explore the pattern of the distribution of EC activities by year, quarter or by ODI manifesto area
- Features to share details of EC activities on social media or to create email reminders, to support ongoing engagement and accountability.
We hope this timeline tool can support a wide range of communities and networks to actively engage with the development of the European Health Data Space – for example, through contributing to consultations, attending conferences and launches, or following and responding to decisions made at official EC meetings.
You can explore this feature on the digital tool here. And you can explore a copy of the source datasheet here .
Next steps
We’re excited to see how people and organisations across Europe might make use of these new features at both a country level and a regional level. We hope they can support the development and implementation of policies for open and trustworthy health data ecosystems. You can also let us know what you think: @ODIHQ (Twitter) or [email protected].