
This is part of a series of case studies on the value of data collaboration that we are producing as part of our partnership with Microsoft.
Summary
In 2020, The Alan Turing Institute (‘The Turing’) transitioned an existing project focused on air quality, into a project to understand ‘busyness’ in London during the Covid-19 pandemic – ‘Project Odysseus’, or PO.
The original air quality project utilised data from city-wide air quality sensors to develop machine learning algorithms and data science platforms to understand and improve air quality over London.
Project Odysseus built on this existing air quality project and used the infrastructure which created datasets capturing mobility, transportation and traffic activity over the city of London to better understand ‘busyness’ (the amount of commuter and pedestrian activity in public spaces) and enable effective decision making during the Covid-19 pandemic.
The key output was providing people who have the ability to make decisions, such as policymakers, with access to more information and more data in a way that is visualised and explained.
What was the challenge?
The Covid-19 virus is spread via contact between people, therefore it has been paramount to government strategies around the world to enforce ‘social’ or ‘physical distancing’ to encourage people to stay apart. This distancing is significantly harder in cities owing to population and housing density, transport links and how cities are designed.
London’s City Hall wanted to understand the ‘busyness’ of major streets across the city to understand both the extent people are staying at home and how the city was recovering economically as things reopened following lockdowns.
The Turing faced the challenge of how to translate raw data on air quality, mobility, transportation, and traffic activity into insights that would be useful as input for decision makers at the Greater London Authority (GLA) and Transport for London (TfL)
How are they addressing the problem?
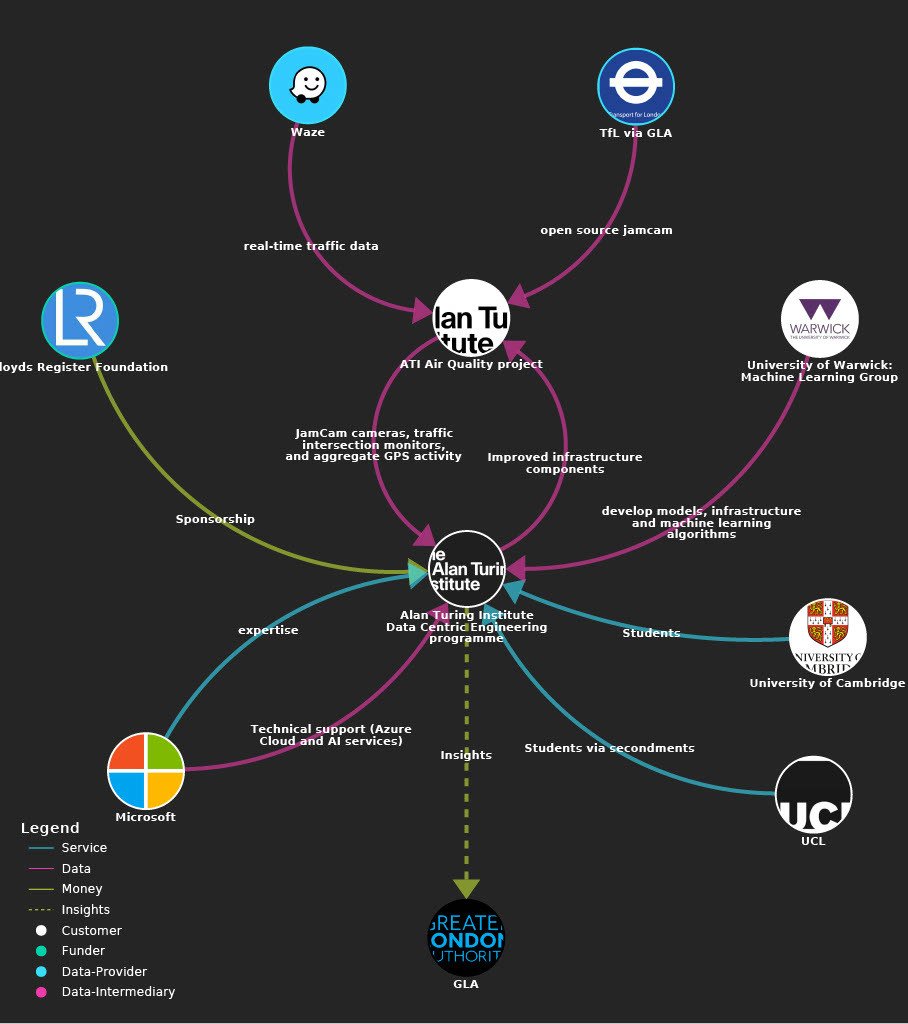
Explore the data ecosystem map further here. For more technical information, please see this map on The Alan Turing Institute site.
How did it work?
The team from The Turing's data-centric engineering programme, funded by the Lloyd's Register Foundation and UK Research and Innovation (UKRI), worked together with researchers from the University of Warwick, University College London and University of Cambridge to develop models, infrastructure and machine learning algorithms. Microsoft was a key technological partner, providing Azure Cloud, AI services and expertise to the project.
Decision makers at the GLA coordinated the capital’s Covid-19 pandemic response with partners. Part of their remit was to keep as many people in the city as safe as possible. To achieve this, they wanted to be able to monitor whether people were staying at home, and whether they were able to maintain ‘social distancing’ (2m) from other pedestrians when they were outside.
The team that were working on air quality were approached by partners at the GLA to work on Covid-19 response, and it became evident that the data they were already processing and the algorithms they had built could be useful for this new purpose.
The pace and scale needed to react to the constantly changing pandemic pushed The Turing into swiftly expanding the team already put together for air quality, bringing in colleagues from other teams with expertise in data science and research and development. This enabled them to organise into smaller teams with more precise focuses, following onboarding by existing team members. There was not a promise of long-term funding, therefore the team prioritised the outputs they could achieve with the time, skills and resources they had.
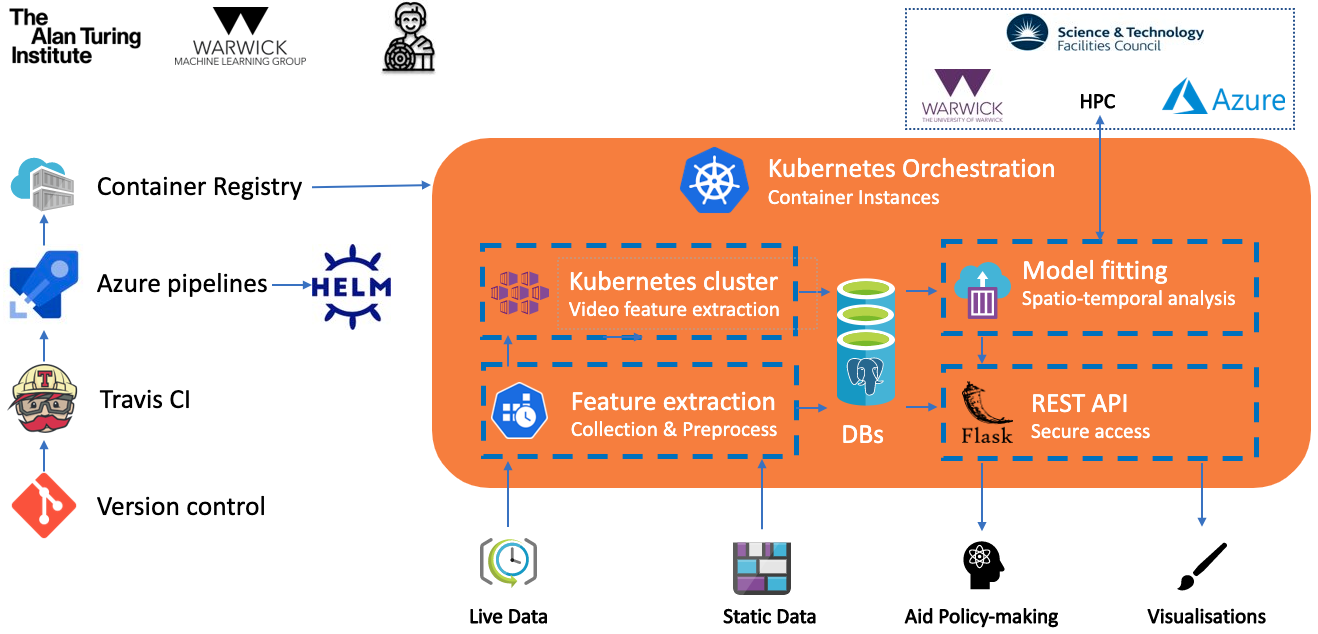
Data and tech
On a technical level, Project Odysseus is a data ingestion system for multiple data sources of London ‘busyness’ data that, among other things, processes data from 900 JamCams (open source traffic cameras) pointed at intersections and pedestrianised areas. Over 600 of those cameras were calibrated so that they could detect where people were, how many people were in the frame, and an estimate of how close they were to each other.
This technology is adapted from the air quality project which focused on forecasting air quality in London to a fine-grained level. Transportation data sources were central to the models generated by the air quality project, as machine learning and deep learning could be run to extract the number and type of vehicles passing through the TfL’s jamcams. This data was originally useful to road network research objectives, for example reducing congestion and emissions, and the derived data from this processing was used to predict air pollution in London.
That project provided the Project Odysseus team with access to the SCOOT sensor network (under road sensors which count vehicles across London) and camera feeds. When Covid-19 hit, many of the people working in the city on mobility and transport data found themselves being asked to use those same data sources to understand the impact of lockdowns and adherence to rules. The primary software component was copied over from the air quality project to Project Odysseus, and new infrastructure was developed so that it was autonomous. The technology was then developed by additional models and by expanding object-detection. Performance was improved by bringing in additional data sources, and additional work was carried out to understand technical problems such as understanding objects better in 3D space, calibrating cameras, detecting urban furniture (such as benches and lamp posts), computing physical distances, and measuring group sizes and average distances.
As the team were experimenting at pace, a number of the novel research projects did not reach the effectiveness required in order to feed into the final output. Instead, they can be used to set up future research and iterations.
Data used:
- SCOOT data
- TfL OS JamCams - fully open source. Use very low image resolution
- Satellite data via ECMWF portal and APIs
- Air pollution measurement from London Air Quality Network (formerly of King's College London but team now at Imperial College London)
- Other additional sources (eg point of sale counts and public transit activity metrics)
What was the impact of the project?
The immediate impact is the delivery of an API that the GrLA, TfL, London Data Commission, and the Office for National Statistics can use to get insight to understand busyness (or air quality) and make decisions based on it. The work will support the GLA with its implementations of visualisation of the analysis, for example through dashboards and analysing the effect of policies and interventions. It helps stakeholders to understand the effects of (and potential to adapt) interventions such as social distancing, or increasing pavement widths, and how these may affect human behaviour – for example whether the average group size on the streets has changed, or whether increasing the pavement widths has changed the behaviour of people walking.
A secondary impact is that the investment into Project Odysseus has improved the original air quality project. Project Odysseus helped to improve the foundations from the air quality project, such as the data ingestion and analytics functions, that can be re-used for future apps and services, for example route planning for air quality, or similar analyses in different cities.
A third impact is that this project can be scaled to other cities and areas who can build infrastructure to replicate the insights generated from both the air quality project and Project Odysseus. The team have been exploring collaborations with other cities who are mature enough to benefit from applying cloud-based systems, with most cities in transportation, for example understanding traffic and congestion, but also policy intervention for the ongoing Covid-19 crisis.
What lessons did they learn?
- The importance of data infrastructure – This case study demonstrates the value in investing in data infrastructure – data assets supported by people, processes and technology. A skilled multidisciplinary team, strong, adaptable data infrastructure and an iterative delivery process allowed the team to deliver value quickly when a new challenge was thrust upon them.
- The importance of data ethics – Data ethics is the evaluation of data practices with the potential to adversely impact on people and society – in data collection, sharing and use. Projects should be considering ethics whenever a purpose for using technology changes. The original technology went from measuring pollution to measuring people, which has significant ethical ramifications. For example, to protect privacy, The Turing requested as low image resolution data as possible so that they could only detect ‘humanoid’ shapes rather than distinguishable features. The team was supported by an ethics committee which helped guide the new developments.
- The importance of data collaboration – There was an existing relationship between The Turing, the universities, Microsoft, GLA, and TfL that enabled the project to get up and running at pace. This enabled the project to get up and running at pace, and also made it possible to convene an ecosystem with a variety of backgrounds and expertise.
The following table maps the ODI’s six manifesto points against key elements identified in the case study
[table id=65 /]
Further reading
- Understanding urban air quality | The Alan Turing Institute
- Helping London to navigate lockdown safely | The Alan Turing Institute