
With huge amounts of data available – and increasingly sophisticated techniques for data collection and analysis – it can be hard to know where to start when you’re planning the data strategy for a new policy initiative.
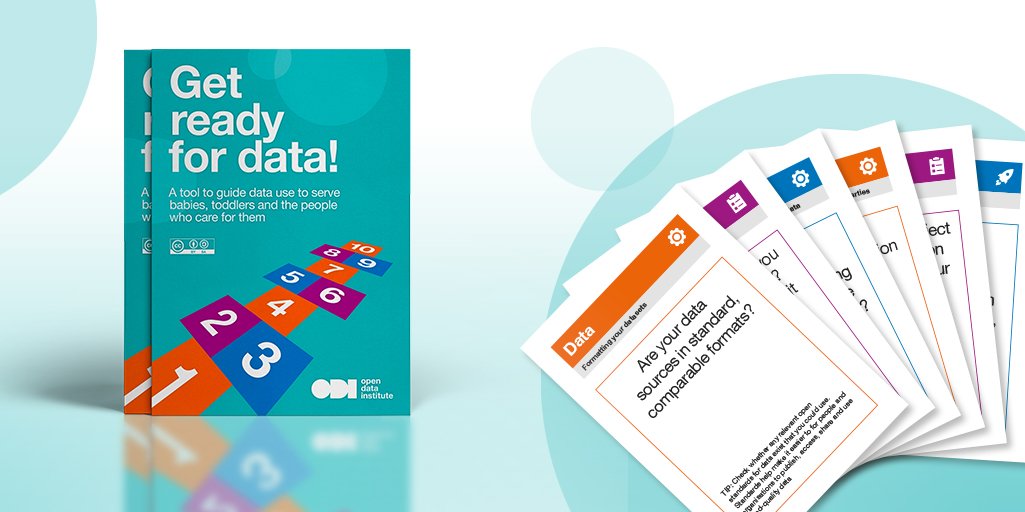
‘Get ready for data’ is a tool designed to help city leaders, officials and urban planners get ready to collect, use and manage data. Particularly when data is used in projects or policy development processes related to early child development in cities, although we expect it could also be useful in other contexts. It covers key areas such as how to choose your data sources, how best to present the data, and how to explore legal and ethical issues that might arise.
The tool can help you to:
- improve planning and decision making
- manage risks and challenges
- encourage teams to co‑create plans
Why do you need a data strategy?
A good data strategy is fundamental for targeting resources efficiently, unlocking the wealth of data that cities often steward and helping city officials at every level make better use of data while minimising harm.
The tool was developed in response to the earlier BVLF and ODI report about the potential of data dashboards to improve early child development in cities and has a particular focus on that problem. In that report, we found cities all over the world already using data to improve their society, economy and environment.
In Rio de Janeiro for example, an NGO that is part of the Urban95 program (Igarapé Institute) has developed a ‘Child Security Index’ to capture and track the impact of violence against children in Brazil. The results of child-friendly surveys are carefully anonymised and visualised in easy to interpret maps and graphs to help policymakers and researchers quickly grasp the issues affecting children within their neighbourhood.
Meanwhile in Istanbul, a team of academics from the Turkish Economic and Social Studies Foundation (TESEV) mapped the distribution of child poverty at the district municipality level to help officials decide where to target spending on early child development interventions.The maps are overlaid with socio-economic indicators such as property prices, and density of the 0-4 age population to help planners make decisions about where to distribute resources and services, such as parks, playgrounds, and service centers.
However, the report also found that some organisations tended to rush towards adopting data dashboards as a solution before having a clear understanding of their user needs or practicalities involved.. We developed this tool with organisations like these in mind, to help them take a step back to carefully consider what data and approach they need to take for the problem they are trying to solve.
Ways to use the cards
This tool consists of topic cards which be used by an individual leader, a team, or in a workshop setting. Each topic card covers key discussion questions, tips, and space for recording actions or decisions.
It comes in a variety of formats including:
- Single page matrix – to be completed by an individual
- A6 small cards – to distribute among a team for discussion
- A4 large cards – to print and use in workshops
- Google doc version – to complete online and collaborate with others
- Links to reports, articles and additional reading
The versions are useful for different settings and types of users: from testing out different designs with a variety of Urban95 organisations, we found that some people preferred to complete all of the questions in the matrix on their own (and then present the information back to their team), while others were looking for a tool that would inspire discussion and peer learning within a workshop setting.
We found that the postcard format is particularly useful in an interactive workshop. It helps the process of peer learning especially within multidisciplinary teams, as people can share their experience or knowledge on particular card topics, and how they handled that issue in the past. The process of working through the cards as a team can also reveal areas where data literacy may be lacking, which can help leaders to develop a comprehensive capacity-building plan.
In the user guide we have shared some ideas for running workshops using the cards. It is designed to sit alongside Bernard van Leer’s Urban95 ‘starter kit’ package of workshop tools and other ODI tools such as the Data Ethics Canvas and a toolkit we are developing to help design data-enabled public services.
What comes next?
Making a plan for data using this tool is just the beginning of the process. We encourage you to communicate your data activities to others in your community, review your progress, develop use cases that demonstrate the impact of data, iterate your plans as needed, and continue to build data literacy among your organisation and implementation partners.
If you have any feedback on this tool, want to share your lessons or want support with using data please tweet us @ODIHQ or email us at [email protected].
Looking for help with using data for city planning?
Get in touch with us. We provide consultancy, training and research and development services.