
As part of our work around predicting the cause and effect of data strategies we developed an agent-based model (ABM) to examine how data sharing can affect innovation.
The ABM is an illustrative model – it doesn’t have any real data in it and instead relies on our ideas. Many of those ideas were taken from research over the past few decades into the economics of information, an academic field that has shown a range of ways in which markets for information may be less efficient in how they produce and distribute products than markets for tangible goods like, say, cars. And we took several of its insights into our data sharing model.
Data exchange between companies can be a type of market, with some types of data being more valuable than others, and companies competing over who collects and has access to data about consumers so that they can offer them profitable goods and services. And as it’s a type of market for information, we needed to ask how efficient it might be.
Information asymmetries
‘Information asymmetries’ are a good example of how a market for data may not work as well as a market for a more traditional product. Work on the market for lemons – which is actually about the market for used cars – by Nobel Prize-winning economist, George Akerlof, sought to show that it was hard for consumers to observe the quality of a product as well as a producer would and that they would therefore suffer from ‘adverse selection’, a type of information asymmetry. When you buy a second-hand car, only the salesman really knows if it’s reliable and you’ll only know if it is once you’ve bought and driven it.
Privacy shock
In our ABM, we illustrate the impact of adverse selection with the ‘privacy shock’ option, which occurs when one or several companies experience a personal-data breach, which undermines the trust of some consumers in that company’s services.
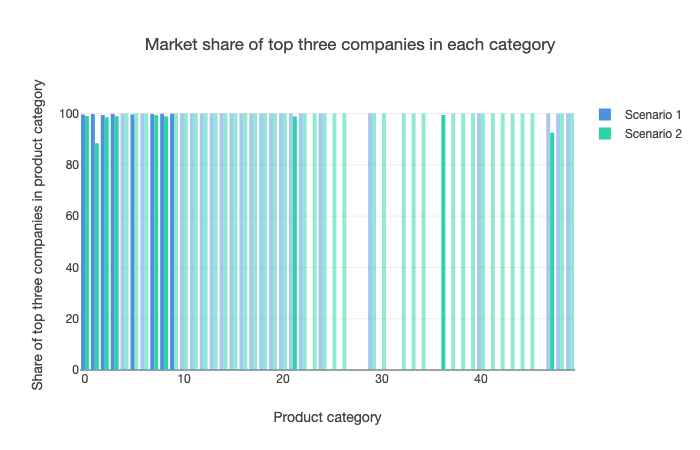
Consumers can observe the apparent quality of products available for purchase – and can be given a privacy preference – but don’t know in early ticks (a ‘tick’ is a unit of time that represents one run-through of an ABM simulation) whether the shock will occur later on. We imagined this as an example of consumers not being able to easily judge a company’s commitment to data privacy, and only discovering the truth about the trustworthiness of the company when the breach occurs. When this happens, consumers in the model trust the companies less - including ones which were not the cause of the original data release - and the possibilities for the sale and purchase of digital services falls. This is shown by the graphic below:
- Scenario one is the 'base case' described below with a privacy shock applied to four big companies rather than two
- Scenario two shows the same conditions but without a privacy shock
The former appears to lead to almost no significant market position for big companies in the more complicated product categories that are available in the model.
Perfect competition
Adverse selection like this is one of many ways in which a market might be said to diverge from the more efficient exchange of goods and services under perfect competition. No market is perfectly competitive, but ones that are close to being so have products that are simple and easy to compare, with companies being able to easily enter and exit the market as they seek to offer the best way of satisfying consumer needs, and the parties involved in an exchange able to internalise the costs and benefits of doing so.
Think of what happens when you buy an apple: you’ve got a pretty good idea of what a nice one should look like, that there are some but not significant differences in quality across your local shops, and the price should be pretty low. As you buy it, you’re paying for not much more than the cost of growing the apple and getting it to you.
Externalities
Markets are likely to be less efficient if they suffer from ‘externalities’, which just means that some of the revenue or costs in an economic exchange are external to the parties involved. Environmental pollution during a production process is a classic example of a damaging externality, with the factory causing pollution, say, often being taxed so that it internalises the full costs of production rather than leaving them to others. There are also positive externalities, for example in public art when lots of people can enjoy it without having to pay.
In our model, companies are able to produce better products if they have access to more and better data, and they tend towards hoarding it because allowing others to externally observe it would mean that they could more easily produce competing products – a behaviour among large digital firms in the real world that is partly motivated by the fear of not being able to maximise the value of the data they control for themselves.
Data hoarding, data fearing
But if data is held by only a small number of companies then it might not be used in ways that create new products and services that help us to, say, travel faster, make better purchasing decisions, or discover new medical cures. On the other hand, if data is used widely in ways which cause harm to the privacy of the people it is about, then trust in the collection and use of data will fall. Data hoarding and data fearing are the two halves of the ODI’s theory of change and the motivation behind data portability schemes such as the European Union’s General Data Protection Regulation (GDPR).
Openness: high, medium or low
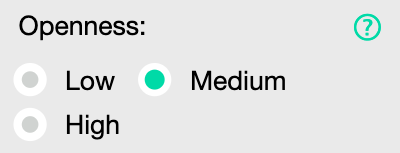
The model allows you to change the level of data sharing in the market through the ‘openness’ option, as shown by the graphic below. It can be set to low – which is the data hoarding world like the one that we’re in at the moment – medium, or high, where companies are in conditions that mean they are more likely to accede to data transfer requests from others.
The companies engage in data sharing by identifying a dataset – for music, photos, and suchlike – in another company that they would like to use, and if the levels of openness are high, the company receiving the request is more likely to grant it. Note that companies have a skill level for dealing with data transfers, which is a proxy for the real-world friction that companies may face in using the technical processes for transferring data securely. The effects of more data sharing are discussed further below.
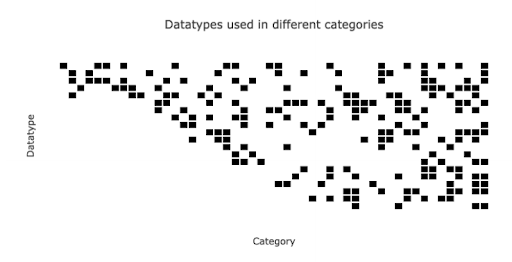
Technological advancement
Companies make more complicated data products as the model runs – as illustrated by the graphic below – as we wanted to include a sense of technological advancement while incorporating product diversity. In the real world, when products are hard to compare consumers have to spend time comparing them or paying someone else to do it for them – like on a price comparison website. But the model incorporates this issue in only a small way as the consumer agents are able to observe the quality of all products.
Economies of scope
Companies in the model can offer products and attract users in a way that allows them to benefit from economies of scope. Just like the way that you use an email service from one company and then use its calendar and mapping services as well because you’re offered an easy way to do so, the model includes an option for ‘consumer preference for multiple products from the same company’. When selected, this means that the model tends towards producing a small number of companies that each offer a large number of products, although the consumer preference for it can be set to low, medium or high.
Base case
To get a handle on the performance of the model we tested it with the aforementioned economic features in mind (number of big companies; privacy concerns; openness, customer preference for multiple products per company; privacy shock). Given that the model is illustrative, it seemed reasonable to compare its results with how we might expect the same ideas to play out in the real world.
And as we’re interested in policy interventions, starting with a proxy of the world as we find it is obviously how we can start to consider the interventions that might affect it. Our ‘base case’ was therefore that there would be:
- four big companies, mixing digital services for music, video, and suchlike in the same way that we see in the real world.
- a medium-level customer privacy concern, reflecting real world consumers’ awareness of privacy issues but not suggesting that they are paralysed by fear of using them.
- a high consumer preference for multiple products from the same company.
- low openness, as per the data hoarding we see in large digital firms.
- a privacy shock applied to two big companies, given that such events are common but not likely to happen to all of them at once.
Running the base case against scenarios with different options selected seemed to show that the basic concepts in the model worked well.
Scenario comparison
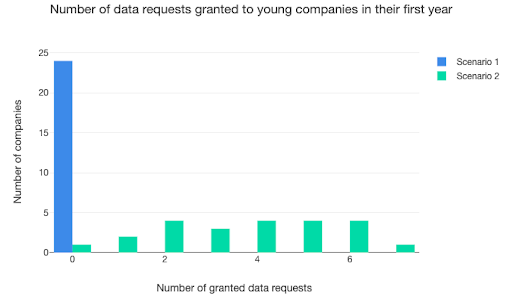
Running the base case – scenario one in the graphics below – against scenario two, which is only different from the base case because openness is set to medium (rather than low), seemed to show that the change in the data-sharing environment causes more data-sharing requests to be granted by companies in their first year of operation.
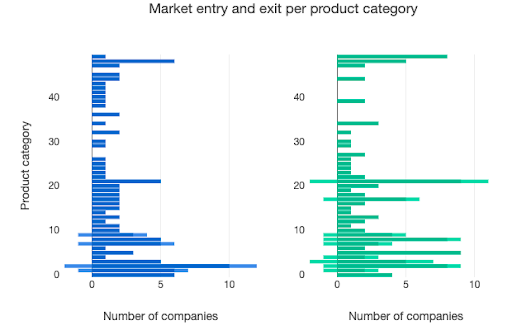
We can also see that more data requests being granted leads to the companies in the model offering products in more product markets. The visualisation below compares the two scenarios, with the graphs showing the different categories of products – such as video sharing or route finding – stacked vertically, and the number of companies providing products in each of those categories – or failing after trying to – on the horizontal axis. In scenario two, with more openness, there are more products being offered – long bars – as companies enter the respective markets.
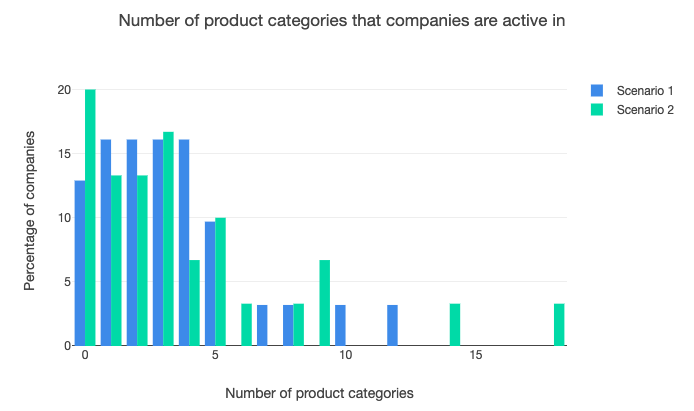
The 'greater dynamism with more openness' is also illustrated by the graphic below, which shows the number of product categories in which companies are active. The far left bars show companies that are no longer operating in any categories: there are more of these in the more open scenario two than in the more closed scenario one. At the same time, more companies in scenario two are offering products across a wider range of categories, shown by the bars on the right.
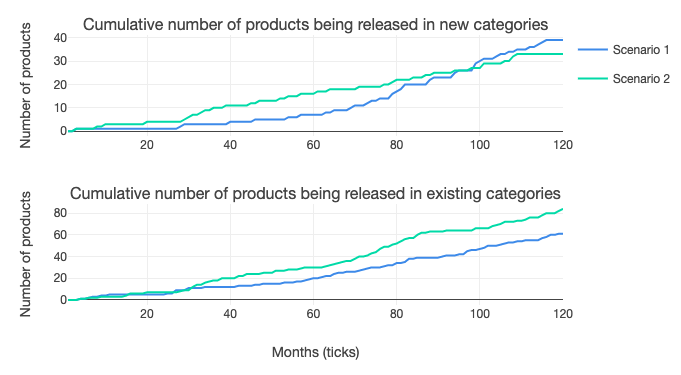
But the greater openness in scenario two doesn’t lead to an increase in the total number of products being offered in new categories. Instead, it means significantly more products being offered in old categories – the ones that the model starts with – perhaps caused by the fact that companies in the model have been set to be more likely to offer products in popular categories, which might also mean older categories.
Greater openness also seems to cause consumers in the model to reduce the number of companies they get products from. This could be explained by the economies of scope available to firms in the model, with some of them being able to offer a wide range of products and reducing the need for consumers to go elsewhere.
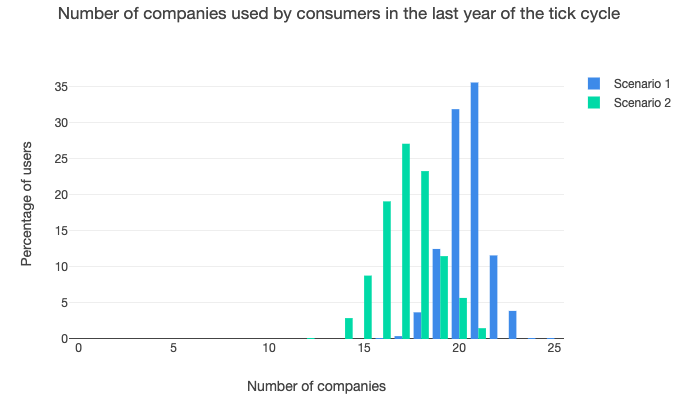
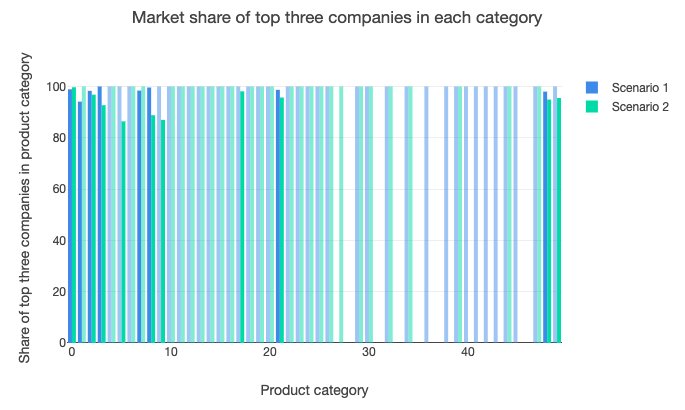
This also leads to the expected result that nearly all product categories are dominated by three large companies in the base case, and many in the more open scenario. This seems to suggest that despite new firms being able to offer more products in the latter, the high preference of consumers for many products from the same company dominates and leads each product category to favour the maintenance or emergence of a small number of companies.
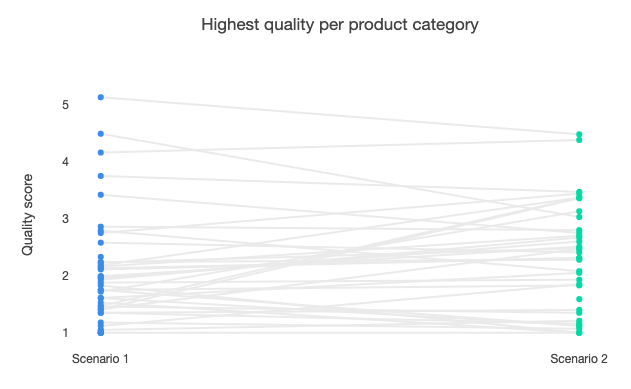
Finally, just altering the level of openness has the effects shown below on the quality of products being offered. In scenario one (low openness) there appears to be a cluster of products with a quality score less than three, but a higher spread than scenario two (medium openness) as the best product on offer has a quality score of over five. The higher level of openness appears to broadly raise the quality of products on offer.
Comparing the outputs of the model with the base case in mind helped us to understand how it performs and to get a handle on whether its results were understandable. As you can see, raising the level of openness and data sharing creates more dynamism and innovation, but not in a way that greatly changes market structure. And that’s probably because companies that are large at the beginning of a run start with advantages, while they also benefit from the platform tendency in the model and the inability of consumers to predict whether a privacy shock will occur.
Get in touch
We’d love to hear from you. To discuss this topic, or anything else around data policy, please get in touch.