
UK’s Build Back Better plan to recover from Covid-19 discusses the transition to net zero and the UK’s plan to achieve it. But what is the data behind this and is it supporting the government’s ambitions?
Author: Eduard Anghel
We’ve been looking at the ecosystems behind emissions and carbon storage data in the UK and analysing some of the available data. The analysis itself and more information can be found in the Jupyter notebook underlying this piece of research.
Build Back Better is the UK government’s post Covid-19 plan for recovery and growth. It discusses how the government plans to tackle climate change and the section is titled Net Zero. This has many definitions, but the government defines it as ‘any emissions would be balanced by schemes to offset an equivalent amount of greenhouse gases from the atmosphere, such as planting trees or using technology like carbon capture and storage’.
We have discovered some important insights from this exploratory work. While it is challenging for a layperson to learn how emissions data is gathered, the dataset provided by the ONS does a good job at making a complex methodology accessible to everyone. There is room for improvement in data timeliness and the formats could be improved and extended, perhaps via a programmatic API. Although the openness of this data is welcomed, it does not allow for certainty in who uses the data and how.
The Department of Business, Energy and Industrial Strategy (BEIS) inventory tool uses dropdown menus, perhaps in an attempt to make it easier to access data. This has the opposite effect for us, as the webpage ended up reloading itself and losing the selected fields. Fixing these problems would improve data access for everyone.
The scarcity and inconsistency of data related to carbon capture, utilisation and storage (CCUS) makes it difficult to paint an accurate picture of the state of the art. This is especially important as CCUS is one of the pillars of the net zero plan, and without consistent reporting, it will be difficult to understand the extent to which this will achieve its intended outcomes.
The legislation concerning climate change is covered in The Climate Change Act. Reports published in 2018 by The Grantham Institute and in 2020 by The Institute for Government noted ‘there are no outright failures and often the problems are not with the act itself, but with the way policymakers have acted under the framework it created’. They highlight the need of the UK government to provide consistent policy and regulatory frameworks for each sector, to work on a sector based practical and coherent plan for achieving emissions reductions and to make key decisions on net zero, developing and implementing policies.
What we know
We looked at what data there is on emissions in the UK and performed a simple analysis. At a high level, the Office for National Statistics (ONS) is publishing a dataset called ‘Atmospheric emissions: greenhouse gases by industry and gas’ and BEIS has its National Atmospheric Emissions Inventory. These are updated on a yearly basis.
The data these organisations use is provided by Ricardo Energy & Environment – a strategic engineering and environmental consultancy, who have, for over 20 years, maintained the BEIS Emissions Inventory. They have an ample explanation of the methodology behind the data, which, alongside ONS’ Quality and Methodology (QMI) document, provide a good explanation of how the data is created, cleaned and processed.
The methodology published by Ricardo EE is over 1,000 pages in length and is potentially inaccessible for the average person. The examples and in-depth explanations provided by the ONS make things easier to understand and they are revised should any methods or systems change, usually, when more data becomes available.
In a nutshell, air emissions are calculated from activity data and emissions factors, using the formula: Emission = Factor x Activity: consider the example where the factor is diesel and the activity is the distance in kilometers driven by cars.
The ONS does not publish data for certain industries, as the emissions were not produced in the UK or by UK businesses – this is a potential complication. Uncertainty – and which industry counts which emission – can also be confusing.
In other words, the estimates are made for the industry of the primary emitter and the industry owning the unit creating emissions. The ONS provides a simple example for this: ‘if a retailer owns a fleet of trucks that deliver stock to its stores, the emissions from those trucks would go to the retail industry. However, if the retailer hires a separate freight company to deliver its goods, the emissions would go to the road freight industry’.
Analysing the data
To understand more about the data we performed our own layperson analysis. We are not climate scientists, but it was a useful hands-on way to look at the data. We looked at the ONS Atmospheric Emissions dataset and the data available on CCUS.
The ONS Atmospheric Emissions dataset
In working with the dataset we learned that it is published as an Excel spreadsheet and it is updated in different months once a year. The spreadsheet is divided into seven sheets of emissions and an additional sheet, providing an aggregate of all emissions.
From our discussions with Ricardo EE, we know they have not had many requests for more timely data. While this might reflect a low demand for this, better timeliness would add value in improving comparisons in the modelling conducted by The Met Office and Bristol University (InTem, Annex 6).
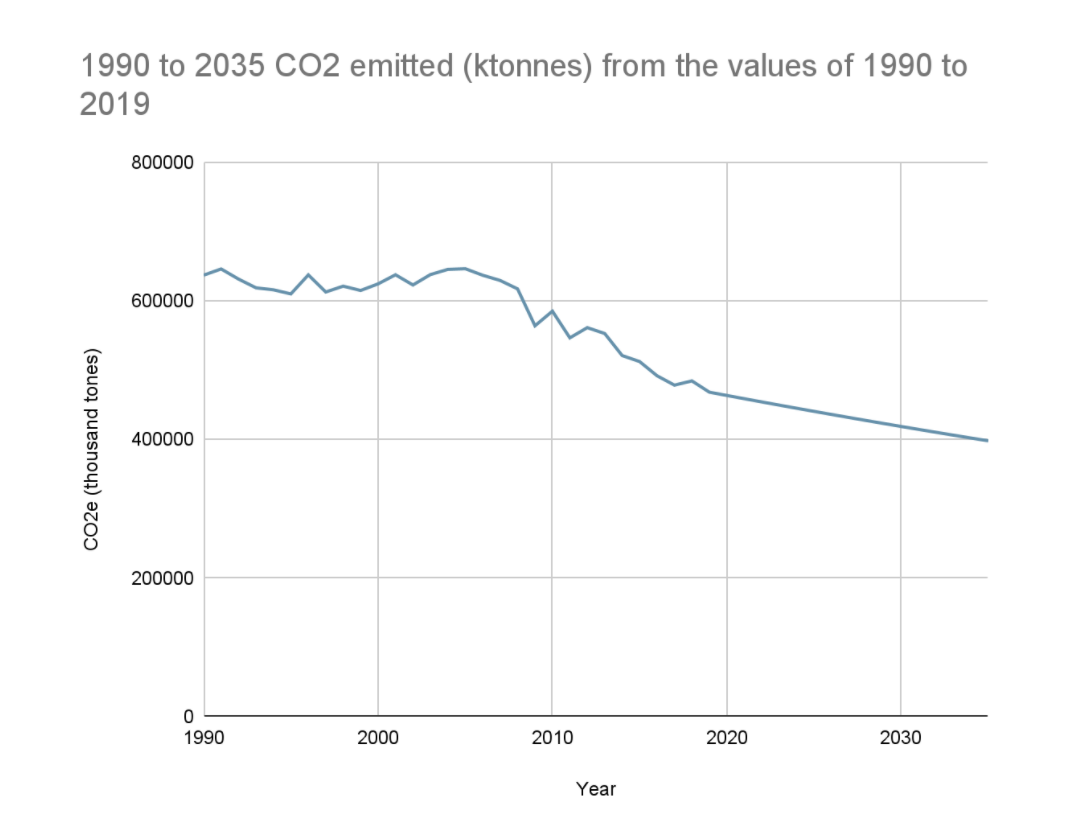
Looking at the CO2 emissions, 1996 saw the largest year-on-year increase, 4.49% compared to 1995; 2009 saw the largest year-on-year decrease, 8.63% compared to 2018. Averaging out the difference between every year resulted in a mean annual decrease of 1.01% in CO2 emissions.
If we were to take this annual mean and apply it for the following years up to and including 2035, it would look like the UK would reach its targets of 78% of 1990s emissions. However, we already know the ONS is not including all emissions in their datasets, due to the way these are constructed and the methodology they use. Moreover, this is a simple analysis of only CO2 emissions, notwithstanding other greenhouse gases.
The QMI document annexed to the ONS’ Atmospheric Emissions dataset briefly discusses the users and the uses of the data: mainly, it is used to satisfy the requirement of providing data to Eurostat. Other potential users are international organisations, the UK and foreign governments, and the research community.
Carbon capture, utilisation and storage (CCUS) data
Compared to the ONS’s dataset, CCUS data is scarce and difficult to find. This is understandable, as the UK has no storage facilities up and running outside of pilots. In the UK, the carbon storage data can be found on the CO2Stored database, which is maintained by the British Geological Survey (BGS). This is hidden behind an application form which requires the maintainers’ approval and it only offers data on potential sites for carbon storage.
Additionally, the CO2Re website provides a list of CCS facilities worldwide. They are provided using Microsoft’s Power BI tool, which does not allow for meaningful export of data for analysis.
The International Energy Agency's (IEA) Technologies Perspectives 2020 report mentions 21 operational plants and CO2Re provides information on 57 operational plants in the UK. Having, for example, the ONS provide a centralised database of such plants would be a good start for providing easier access to this information. This database could be expanded to include the amount of carbon captured, used and stored, in an aggregated and disaggregated manner, similar to the emissions dataset previously mentioned.
Conclusion
The emissions data, reported by the ONS, is not sufficient to enable us to draw conclusions on whether the UK is on track to achieve the targets set. In fact, as the analysis above explained, based on that data alone, it would look like the UK is on track to achieve its targets, but that may not be the case when considering the wider picture.
Acknowledgements
Commissioned by the ODI in partnership with King’s College London and H2020 ACTION project, grant number 824603.